Statistical distribution in Statistical Process Control (SPC) and probability theory help to model real-world phenomena and to make predictions based on data. As a result, a fair understanding of statistical distribution, its applications in SPC, and the patterns of variations in statistical distribution are important for anyone tasked with process monitoring.
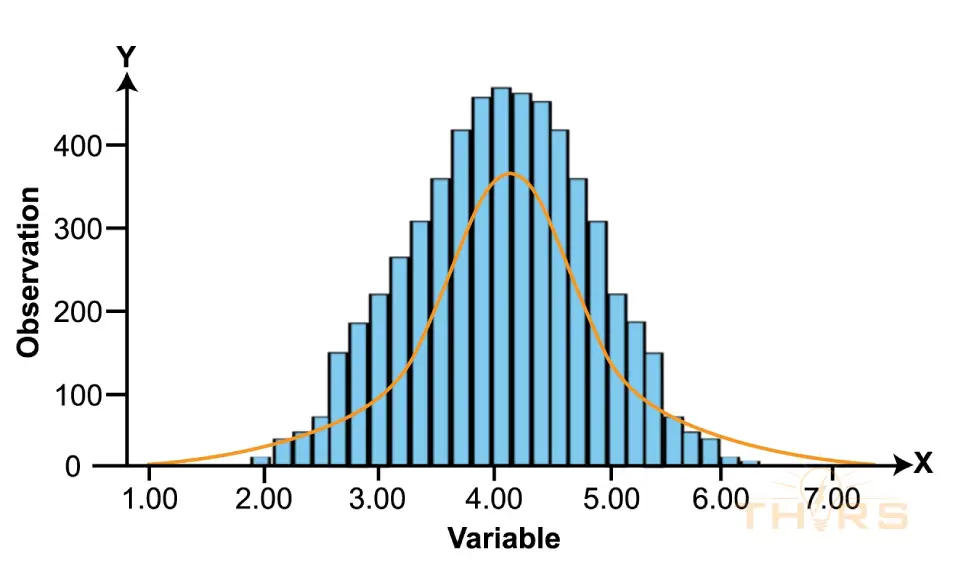
In SPC, statistical distribution is used to graphically represent the sample data with the aim to predict the probability of occurrence of variations in a process. In statistical distribution, the mean value is considered the center of the data sample. The proximity of the data points to the mean value is measured by marking the three standard deviations on either side of the mean value. The standard deviations on the right side of the mean value are 1σ, 2σ, and 3σ. The standard deviations on the left side of the mean valve are −1σ, −2σ, and −3σ.
What Are the Applications of Statistical Distribution in SPC?
Statistical distributions are applied to monitor and improve the performance of a process and they are considered a key concept in statistical process control. Some of the applications of statistical distribution in SPC include:
Understanding Process Variation
One of the key applications of statistical distribution in SPC is to understand the variation in a process. By fitting a distribution to the data collected from a process, practitioners can gain insights into the sources of variation and the characteristics of the process. The distribution provides a way to describe the spread of the data, the central tendency of the data, and the shape of the distribution.
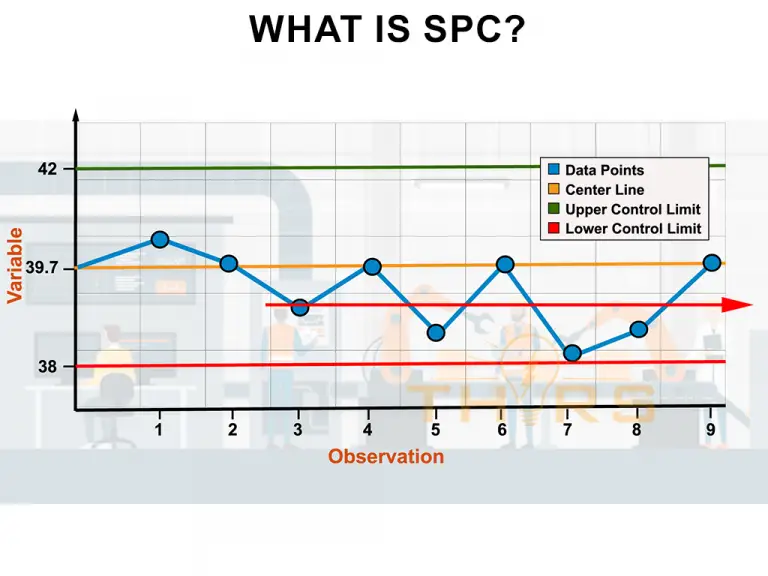
Developing Control Charts
Statistical distributions are used to calculate control limits for control charts, which are used to monitor the performance of a process over time. Control limits are based on the mean and standard deviation of the data and provide a visual indication of whether the process is in control or out of control. The control limits are calculated based on the properties of the distribution, and they provide a way to detect when the process is producing output that is outside of the expected range.
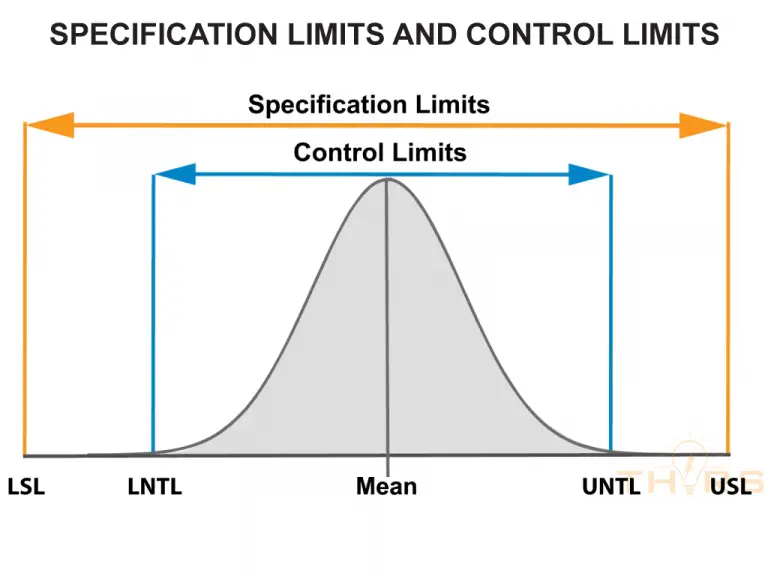
Analyzing Process Capability
Statistical distributions are used to assess process capability, which is the ability of a process to consistently produce output that meets customer specifications. Process capability analysis is based on the standard deviation of the process and assumes that the process follows a normal distribution. The distribution provides a way to estimate the probability of producing output that is within the customer’s specifications, and it provides a way to identify opportunities for process improvement.
Hypothesis Testing
Statistical distributions are used in hypothesis testing to determine the probability of observing a particular outcome. By comparing the observed data to a hypothesized distribution, practitioners can determine whether there is evidence to support or reject the hypothesis. The distribution provides a way to calculate the probability of observing the data under different assumptions, and it provides a way to make decisions based on the evidence.
Predictive Modeling
Statistical distributions are used in predictive modeling to estimate the probability of different outcomes. By fitting a distribution to historical data, practitioners can use the distribution to make predictions about future outcomes. The distribution provides a way to estimate the probability of different scenarios and to make decisions based on the predicted outcomes.
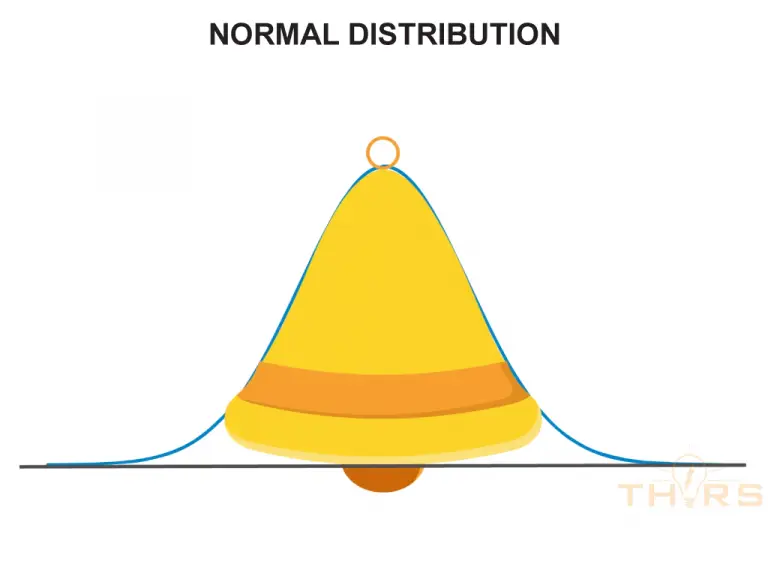
What Is Normal Distribution?
Normal distribution, also known as the Gaussian distribution, is a commonly encountered statistical distribution that is graphically represented in the shape of a bell curve to model the probability distribution of a continuous random variable, such as the diameter of a manufactured part or the weight of a product. In a normal distribution, by empirical rule, approximately 68.27% of the data falls within one standard deviation of the mean, 95.45% of the data falls within two standard deviations, and 99.73% of the data falls within three standard deviations.
What Are the Patterns of Variations in Statistical Distribution?
When variations occur, the pattern of distribution can vary graphically by location, spread, or shape.
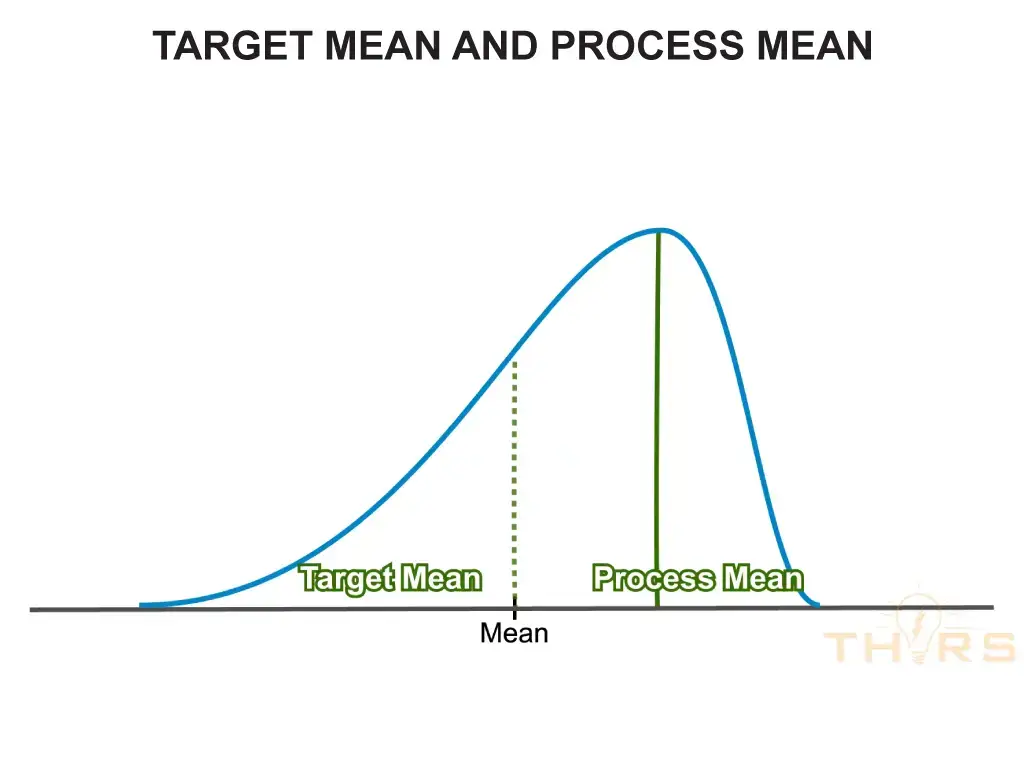
By Location
The pattern of distribution can vary by location if the process mean achieved varies from the target mean.
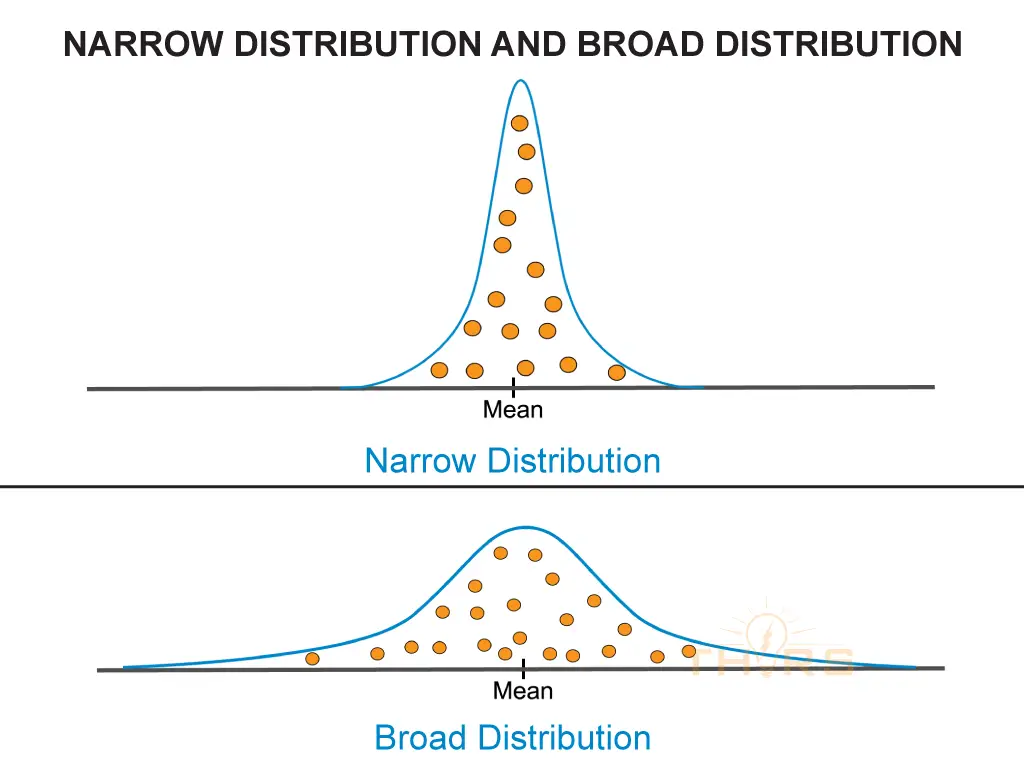
By Spread
The pattern of distribution can vary by spread based on the proximity of data points to the mean. If data points are close to the mean, the bell curve will show a narrow distribution. On the other hand, if the data points are farther from the mean, the bell curve will show a broader distribution.
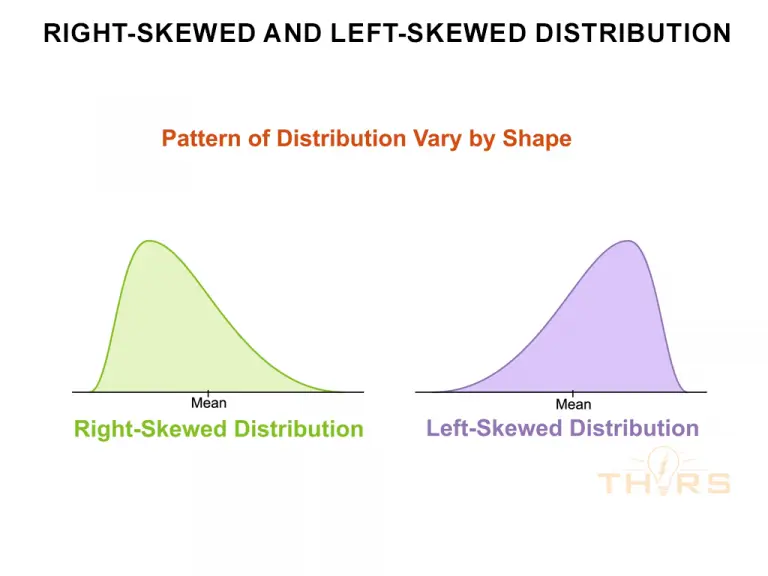
By Shape
The pattern of distribution can vary by shape if the variations are asymmetrically scattered to one side of the mean. In this case, the distribution curve will show a right-skewed distribution or a left-skewed distribution.
Final Thoughts
Statistical distributions play a critical role in SPC by providing a framework for understanding process variability, calculating control limits, assessing process capability, hypothesis testing, and predictive modeling. By leveraging the properties of statistical distributions, practitioners can make informed decisions about process control and improvement. Understanding and applying statistical distribution is essential for effective SPC, and it is a key component of a successful quality management system. To learn more about statistical distribution in SPC, check out our THORS course on SPC.


