


Manufacturing Fundamentals
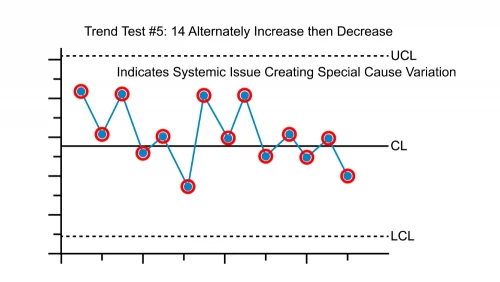
Role of Quality Control in Manufacturing
Quality control is the often overlooked yet highly crucial aspect manufacturing. It serves to ensure products meet the necessary requisites of the effective functionality and durability.
Quality
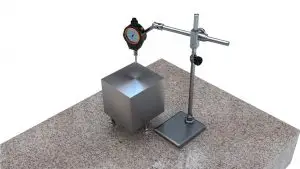
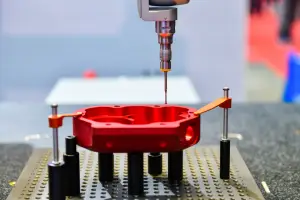
CMM Measurement Optimization: Best Practices for Accurate Results
Throughout the years, Coordinate Measuring Machines (CMMs) have earned a reputation for delivering accurate measurement results better than many other traditional metrologies. Implementing some best

Training
Training Perspective: Looking Back to Look Ahead
Companies are constantly reviewing ways to reduce costs and keep positive margins. During times of economic recession, external pressures from competitors as well as internal pressures