
Training
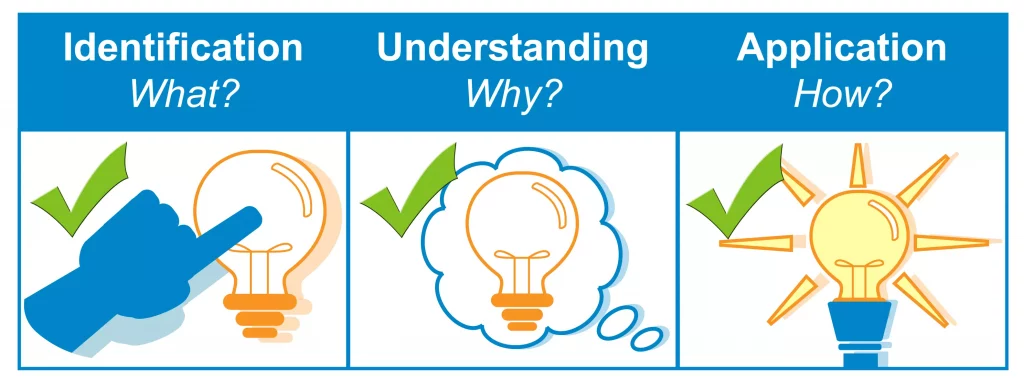
Is Your Issue a Skills Gap or a Knowledge Gap?
You may have received a call to action to address the skills gap, which might feel making a bridge across the Grand Canyon with a
Manufacturing Fundamentals
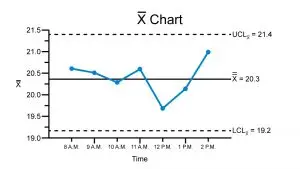
How Statistics Is Used in Everyday Life
How Statistics Is Used in Everyday Life Statistics often remind us of data tables, charts, and calculations, but they are far more deeply woven into
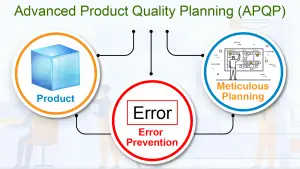
Quality
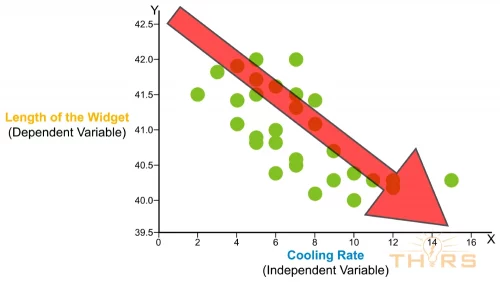
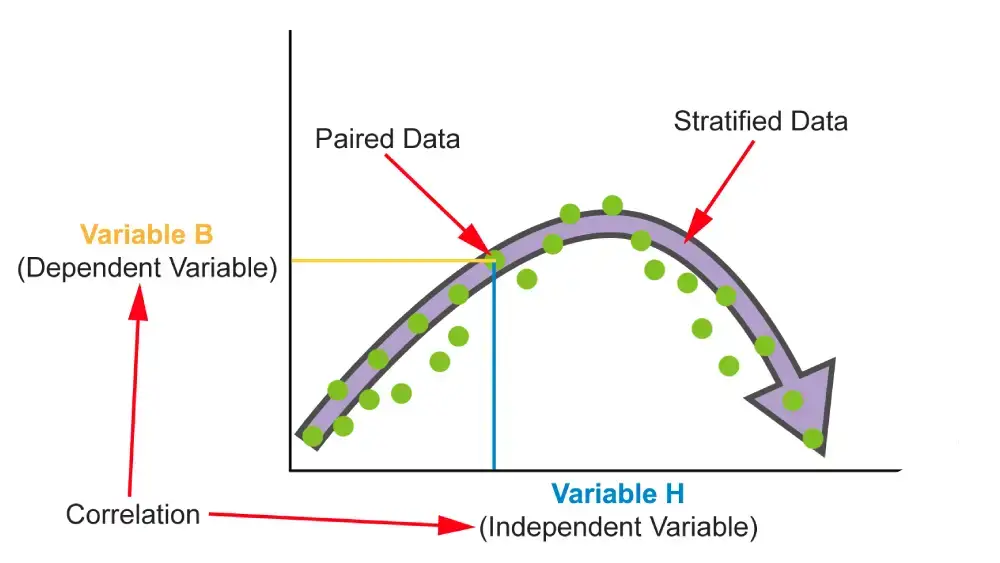
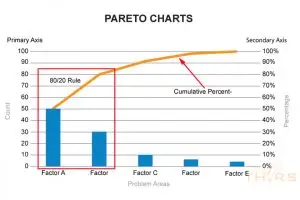
7QCs: An Introduction to the Seven Basic Tools of Quality Control
Quality control. Of course it is important. When producing parts or products, the ability to monitor, troubleshoot, and adjust manufacturing processes is necessary for companies