
Quality
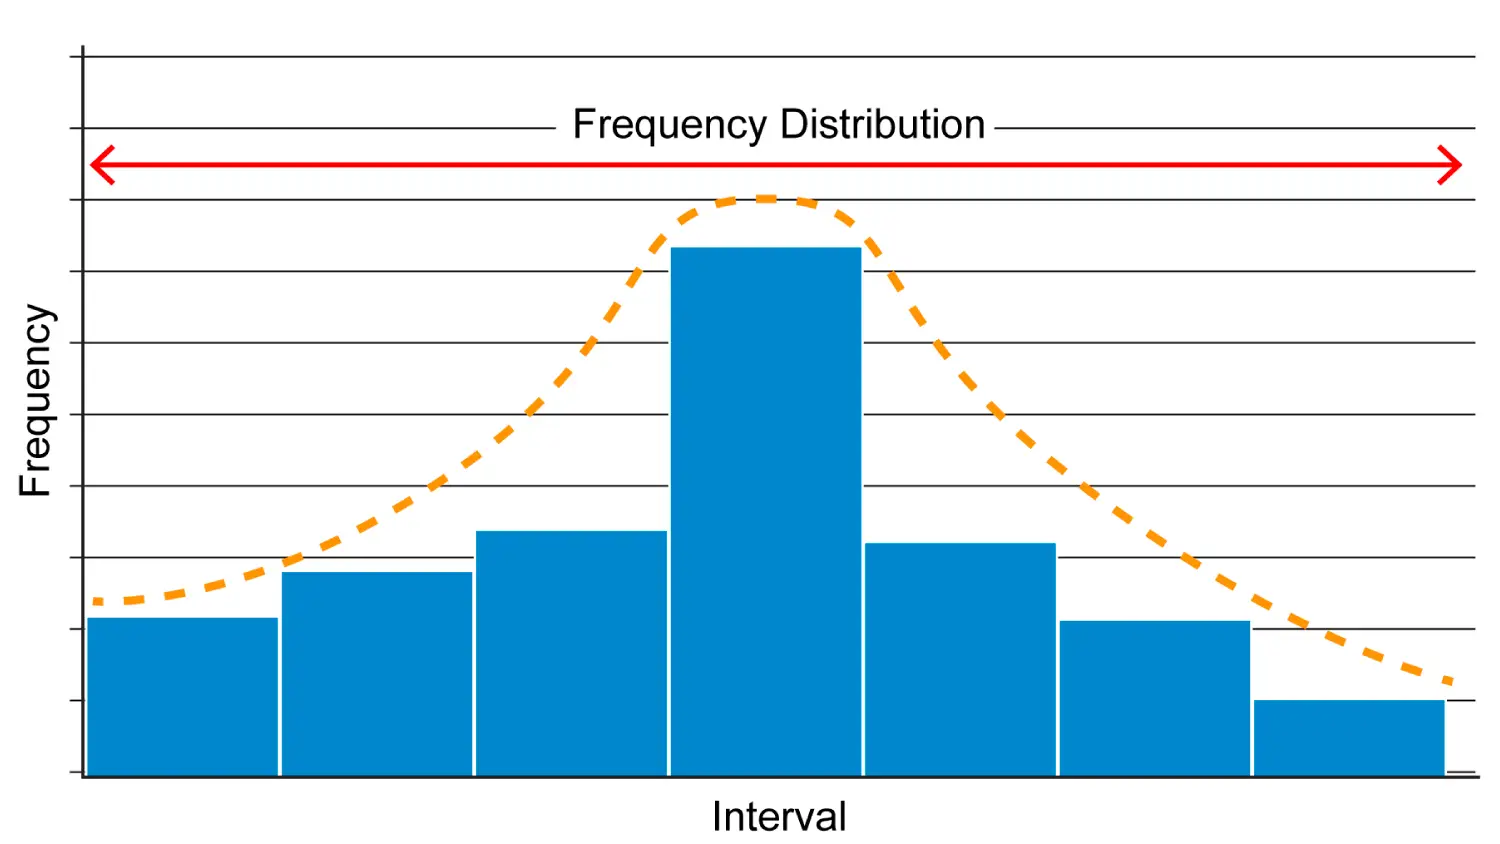
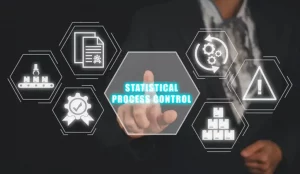
A Guide to Selecting Variable Data Control Charts for SPC
To monitor, control, and improve manufacturing processes, a systematic approach such as Statistical Process Control (SPC) is indispensable in evaluating the stability of a particular
Quality
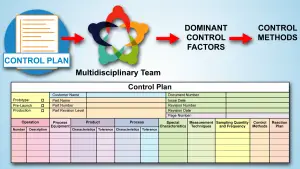
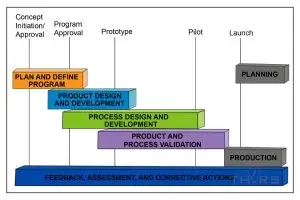
Advanced Product Quality Planning: 5 Phases of APQP
Advanced Product Quality Planning (APQP) helps an organization with effective cost and time management by dividing a product development process into the five phases of

Training
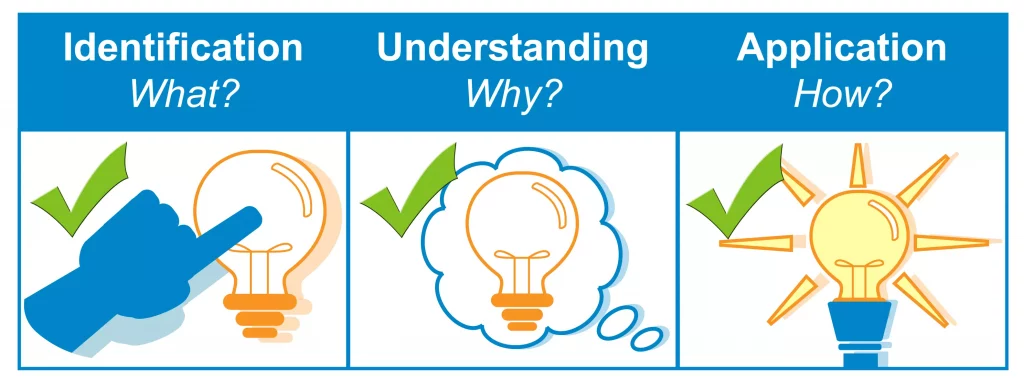
5 Ways to Reduce Human Errors in Manufacturing
We cannot change the human condition, but in manufacturing we can certainly improve the way people work, where they work, and what systems they use.