Course Description
Affinity Diagrams provides learners with a thorough understanding of the terminology and methodology associated with affinity diagrams. Presented in THORS’ highly visual and interactive learning format, this course will help learners become familiar with the important terminology and methodology associated with affinity diagrams.

Who will benefit from this Affinity Diagrams course?
Any management professional who is involved in the quality assurance processes. Though the examples in this course pertain to the manufacturing industry, affinity diagrams can be applied universally. Affinity diagrams help anyone who approaches management problem solving with a scientific, systematic, and proven methodology.
Course Classification
*THORS uses the Bloom’s Taxonomy Methodology for our course development.
Certificate Awarded for Affinity Diagrams
*upon successful completion
Related Posts

Role of Quality Control in Manufacturing
Quality control is the often overlooked yet highly crucial aspect manufacturing. It serves to ensure products meet the necessary requisites of the effective functionality and durability.

What is Statistical Distribution in SPC?
Statistical distribution in Statistical Process Control (SPC) and probability theory help to model real-world phenomena and to make predictions based on data. As a result,

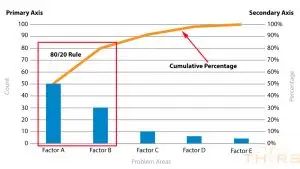
A Guide to Selecting Variable Data Control Charts for SPC
To monitor, control, and improve manufacturing processes, a systematic approach such as Statistical Process Control (SPC) is indispensable in evaluating the stability of a particular


