THORS eLearning Solutions

Statistical Process Control (SPC) Basics

$180.00

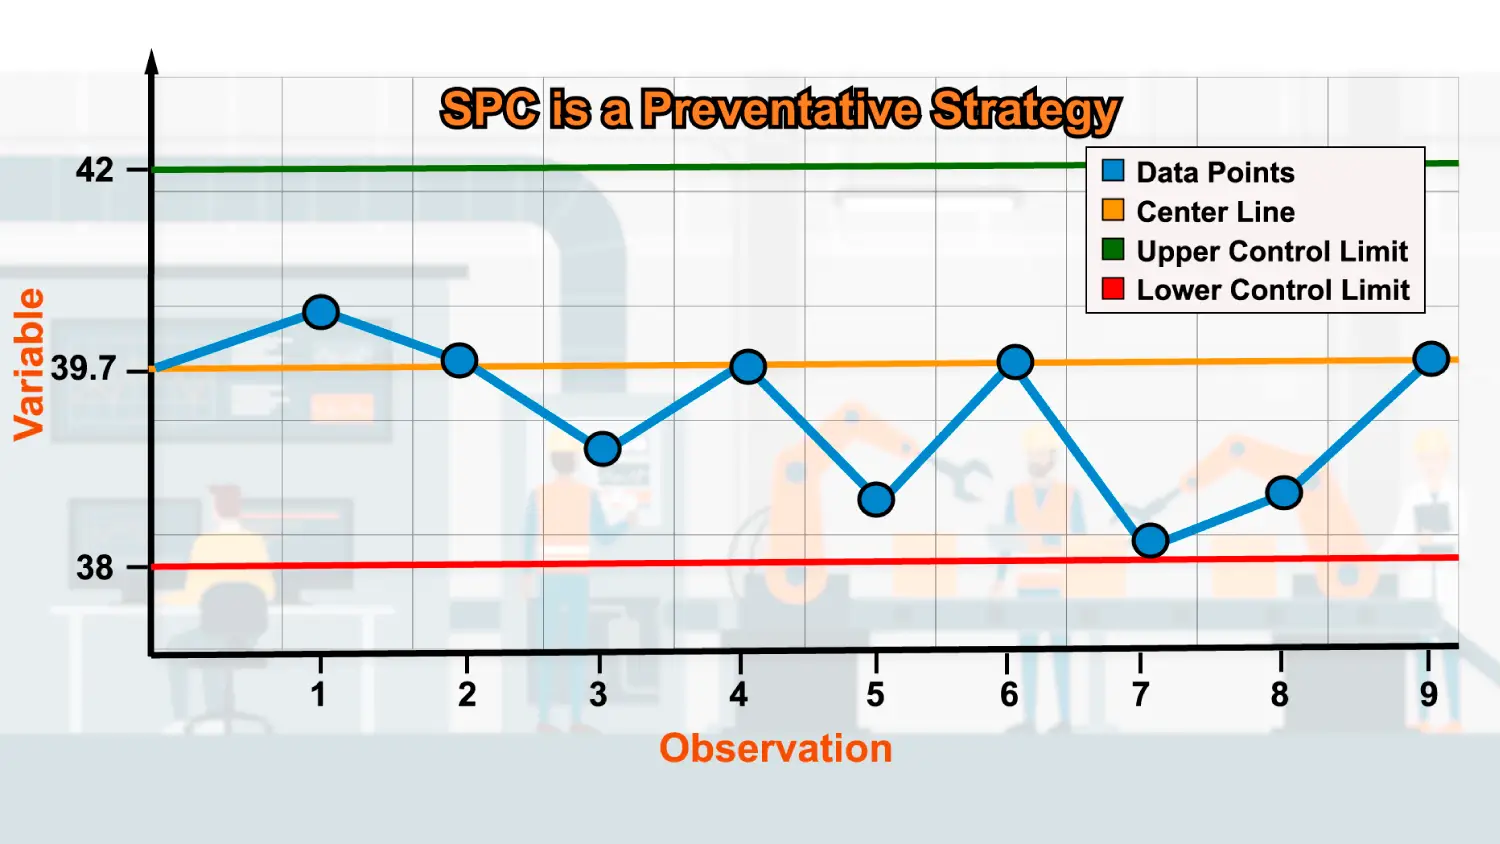
Variations are inherent to a process. An organization should effectively employ statistical process control (SPC) to reduce variations and eliminate nonconformance.
Learning Hours: 2

Representative or member of a corporation, educational institution, or trade organization? Contact us to discuss special pricing and additional benefits, including course activity reports for your group.

Contact Sales For Group Pricing

Purchase Individual Access

Course Description

Variations are inherent to a process. An organization should effectively employ statistical process control (SPC) measures to reduce variations and eliminate nonconformance. This course offers a comprehensive overview of the basic statistical concepts, such as a process control system, process measures, control chart structure, and process capability. This course, presented in a visually engaging and highly interactive format, gauges your mind for a broader understanding of SPC.

YouTube player

Who will benefit from this statistical process control (SPC) course?

Marketing, Sales, Design, Engineering (Product and Process), Purchasing, Manufacturing, Quality, and Service functions at organizations that require an understanding of statistical process control; Any learner who is required to understand and use SPC

Course Classification
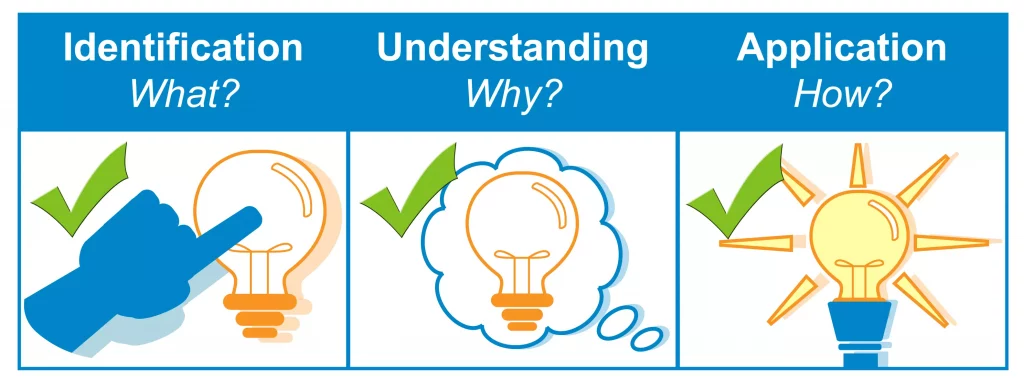
This manufacturing course by THORS eLearning Solutions covers identification of key terms, understanding of key concepts, and application of the covered topics.

*THORS uses the Bloom’s Taxonomy Methodology for our course development.

Certificate Awarded for Statistical Process Control (SPC) Basics
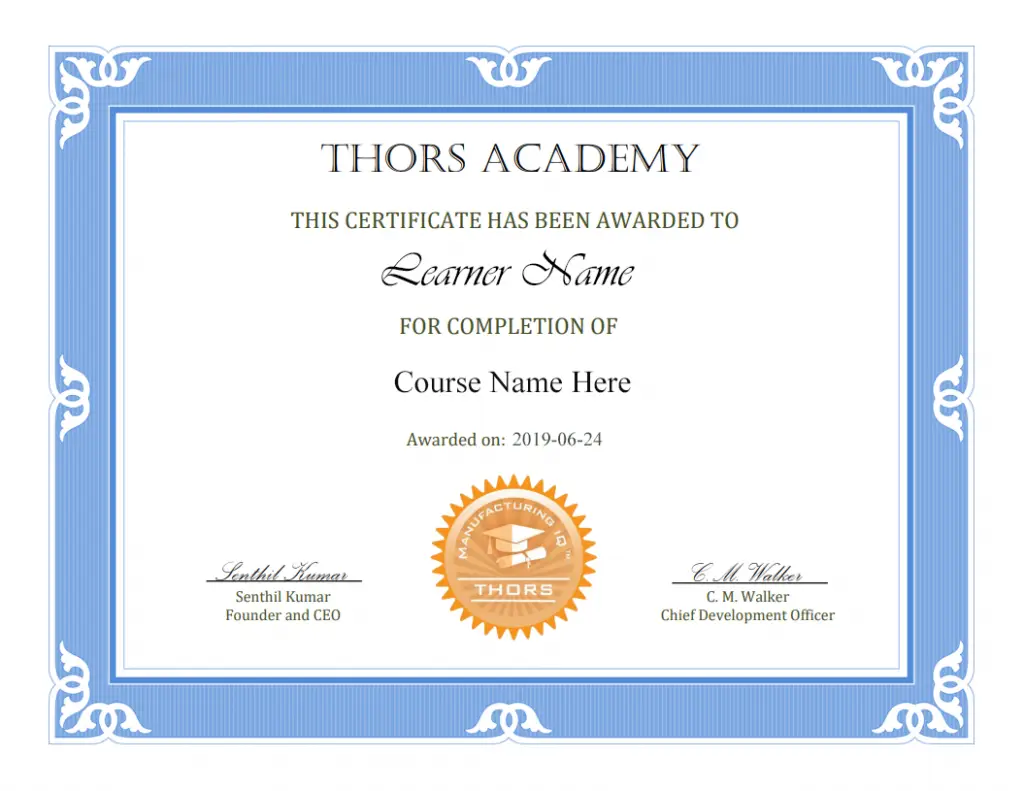
Example of certificate awarded upon successful completion of the course.

*upon successful completion

Related Posts

Learning Objectives

  1. Recall the basic elements of a process control system.
  2. Define the process measures for variable data and attribute data.
  3. Interpret the graphical representation of data points in statistical distribution.
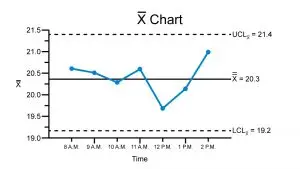
  4. Identify the elements of a control chart.
  5. Interpret the relationship between specification limits and control limits for process capability.
  6. Analyze process capability through process capability indices and process performance indices.
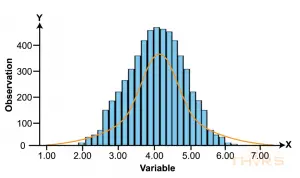
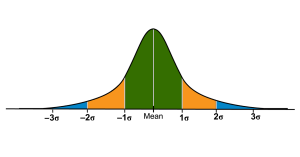
Statistical distribution in SPC represents the proximity of a data point to the mean value.
Statistical Process Control (SPC) Basics Course

Table of Contents

  1. Basic Statistical Concepts
    1. Process Control System
      1. Process
      2. Variations
        1. Sources
        2. Principles
        3. Types
          1. Common Cause Variations
          2. Special Cause Variations
      3. Actions
        1. Local Actions
        2. Actions on the System
    2. Process Measures
      1. Process Measures for Variable Data
        1. Measures of Central Tendency
          1. Mean
          2. Median
          3. Mode
        2. Measures of Dispersion
          1. Range
          2. Standard Deviation
      2. Process Measures for Attribute Data
        1. Percentage Defective (P)
        2. Defects Per Unit (DPU)
    3. Statistical Distribution
    4. Control Chart Structure
      1. Chart Elements
      2. Subgroup
      3. Patterns Evaluation
  2. Process Capability
    1. Process Capability Prerequisites
    2. Initial Process Studies
    3. Process Capability Analysis
      1. Specification Limits and Control Limits
      2. Specification Limits-Control Limits Relationship
        1. Control Limits Less than Specification Limits
        2. Control Limits Equal to Specification Limits
        3. Control Limits Greater than Specification Limits
    4. Process Capability Characteristics
      1. Process Capability Indices
        1. Cp Index
        2. Cpk Index
      2. Parts Per Million (PPM)
    5. Process Performance
      1. Pp Index
      2. Ppk Index

Request Course Demo

Cookie Consent with Real Cookie Banner