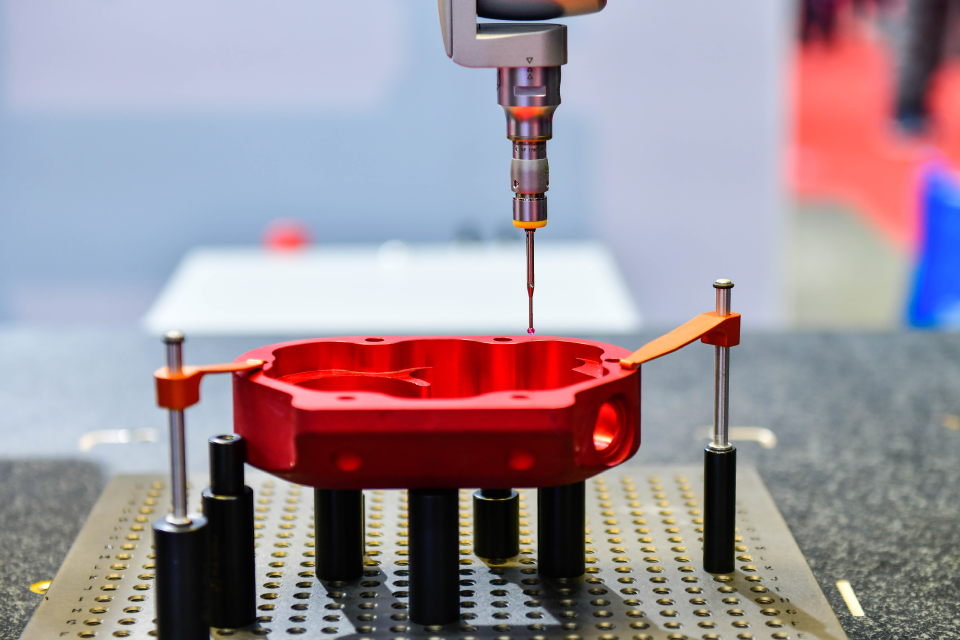
Quality control. Of course it is important. When producing parts or products, the ability to monitor, troubleshoot, and adjust manufacturing processes is necessary for companies to remain efficient and competitive. If products are to be made consistently to a required standard, the methods of manufacturing must be measurable, adjustable, and repeatable.
In order to achieve these standards, logical, data driven approaches to finding acceptable solutions can be used, such as the 7QC tools, or the Seven Basic Tools of Quality Control. The 7QC tools are statistical tools that help individuals, organizations, and businesses resolve quality issues for products and processes. They are called basic tools because they are suitable for people with little formal training in statistics and because they can be used to solve the vast majority of quality-related issues.
7QC tools include:
Check Sheets
Check sheets are used to collect data in order to understand the qualitative and quantitative variables that can affect a process. When recording data on a check sheet, check marks or tally marks are used to indicate the amount of what is being collected, which helps in understanding the progress, defect patterns, and even causes for defects.

Control Charts
Control charts are graphs used to represent process performance over time. Subgroups of data points are collected and compiled together within a short interval of time. The average of the data points within a subgroup is represented as a single dot in the control chart. The amount of variation that exists within a sample data set is the standard deviation, which is used to determine the control limits. When the subgroups exist beyond the control limits or exhibit specific patterns or trends, then the process is said to be “out-of-control.”

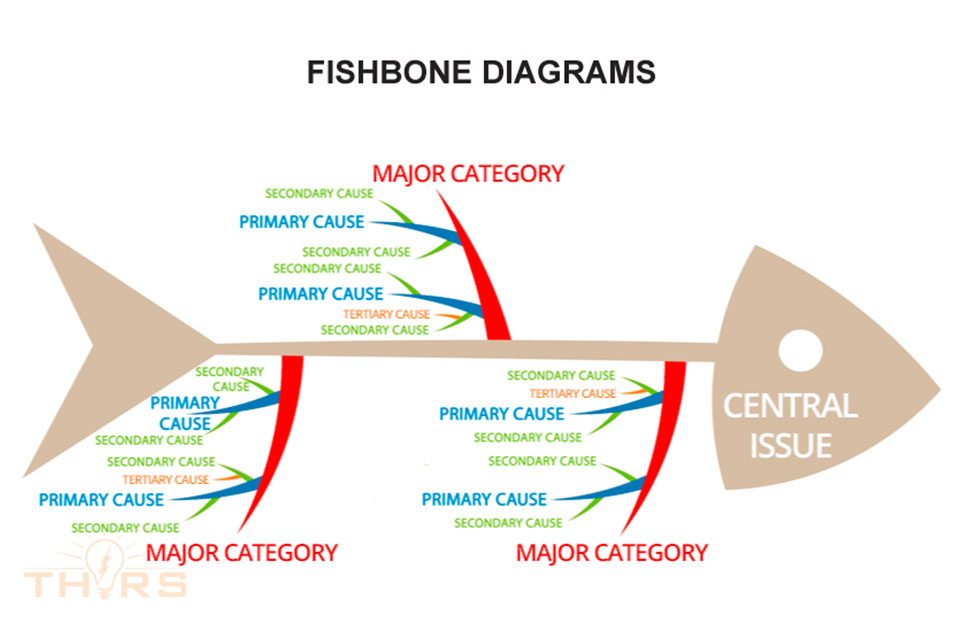
Fishbone Diagrams
Fishbone diagrams, also referred to as cause and effect diagrams, are a quality control brainstorming tool used to help identify the root cause or causes of an issue by looking at all possible variables.
When using these diagrams, a central issue or focal point, such as a defect or quality problem, is placed at the head of the “fish.” The “bones of the fish” serve as a way to visually organize all possible variables, or causes, that may have caused the central issue, and sort ideas into categories to investigate further.

Histograms
Histograms are a type of bar graph used to represent the frequency distribution, or how often each different value in a set of data occurs. It is created by grouping the data you collect into “cells” or “bins.” The histogram is the most commonly used graph to assess process behavior and demonstrate if the data follow a normal distribution, or bell-shaped curve.

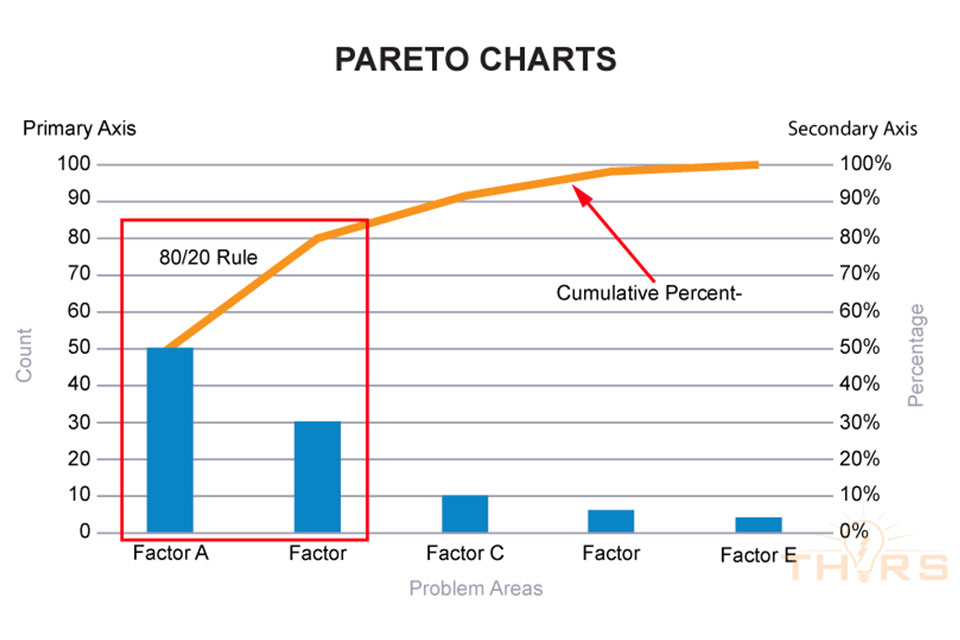
Pareto Charts
Pareto charts are a combination of bar and line graphs that provide a visual representation of how often the various issues affecting a process are occurring. Pareto chart derives its name from the use of the Pareto Principle, which states “80% of the effect comes from 20% of the causes.” Using this chart, professionals can decide where to place priority and focus.

Scatter Diagrams
Scatter diagrams, also called scatter plots, are graphs used to visually represent the relationship between two variables in order to quickly identify the correlation between them.
This tool is used to determine the type of relationship that exists between the inputs to the process, or process characteristics, and the outputs from a process, or product characteristics.

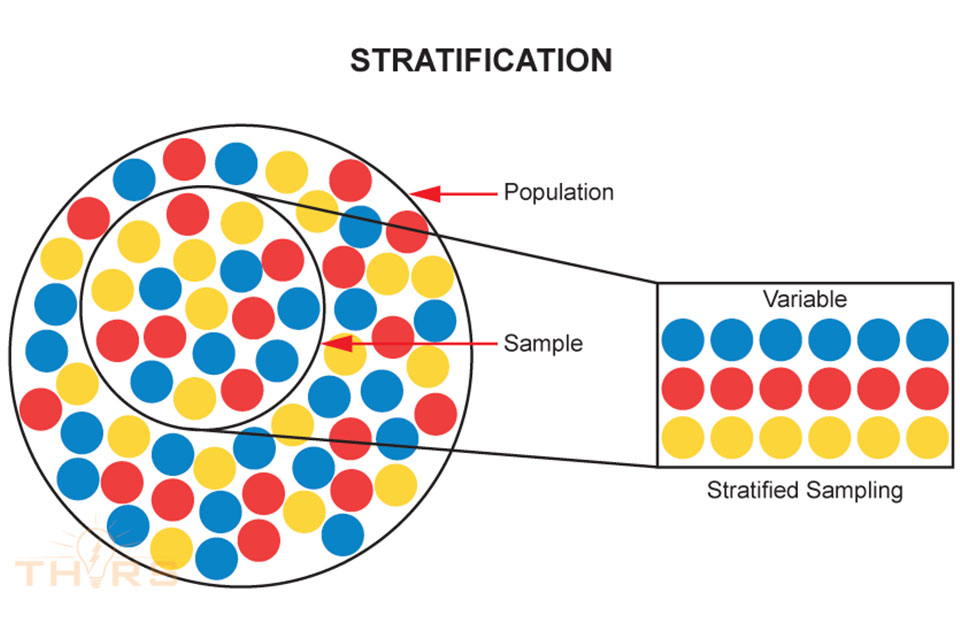
Stratification
Stratification is a method of dividing data into subcategories and classifying data based on group, division, class, or levels that helps in deriving meaningful information to understand an existing problem.

To learn more about these Seven Basic Tools of Quality Control, and to learn how to apply these tools to solving quality problems by viewing examples, check out the online 7QC courses in the THORS Academy Library, brought to you by THORS eLearning Solutions.