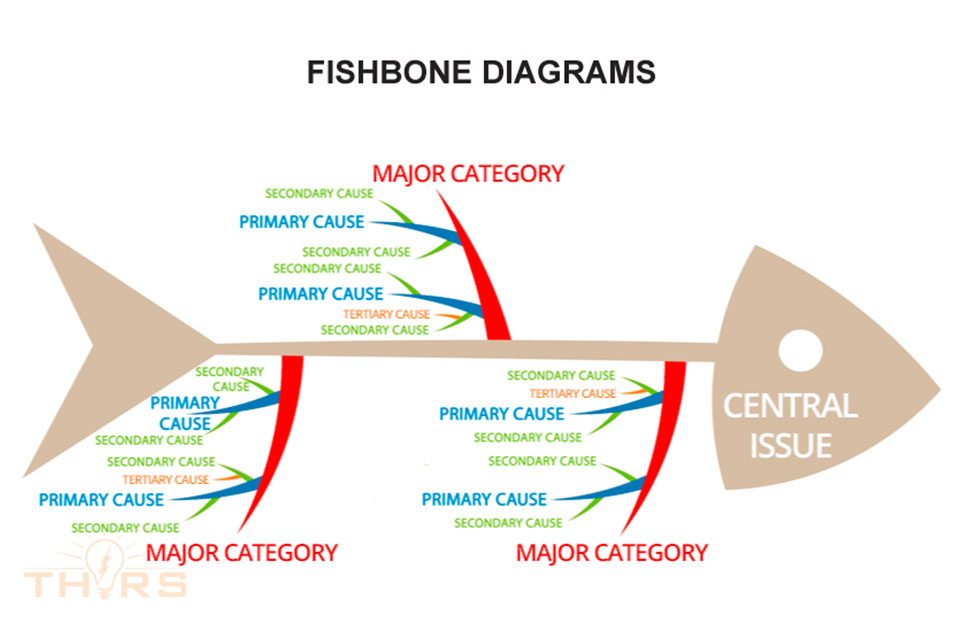
There can be many opinions as to what the root cause of a problem is, especially when there is a team tasked with solving an issue. A cause and effect diagram is a good way to capture these different ideas and stimulate the team’s brainstorming effort to identify probable root causes. This type of cause and effect diagrams are also known as a fishbone diagrams, or Ishikawa diagrams. The fishbone diagram is one of the most important quality tools out of the 7 Quality Control tools used in process improvement.
Dr. Kaoru Ishikawa, a Japanese quality control expert, is credited with creating the fishbone diagram to help employees easily identify many possible causes and factors of a much larger problem and help sort these ideas into useful categories.
The diagram is particularly useful in a team setting and for situations in which little quantitative data is available for analysis. Moreover, the fishbone diagram captures visually the many potential causes of a specific problem or effect, with the problem or effect displayed at the mouth of the \”fish\” and the possible causes listed along the smaller bones of the \”fish\” under various cause categories.
How to create the fishbone diagram
To create a fishbone diagram, first identify the main issue of concern which could be a quality issue, not meeting metrics, or troubleshooting in the form of a question such as \”Why was the product delivery deadline missed?\”. Be as clear and specific as you can about the problem. A \”why\” question will help in brainstorming, as each root cause should result in an answer to that question. All team members should agree on the statement of the problem. This statement is then added at the mouth of the \”fish\”, and then individual bones branch out vertically on either side of the main line connecting the \”fish head\” to the \”fish tail\”.
These individual branches are clustered into different categories. For the manufacturing industry, some of the typical categories include the following:
- Machines
- Methods
- Materials
- Measurements
- Environment
- People
Upon completion of the diagram, different employees should be able to understand the root causes of the central problem and then work towards avoiding those issues in the future.
Want to learn more about fishbone diagrams?