THORS eLearning Solutions

7QC Tools Mastery Module

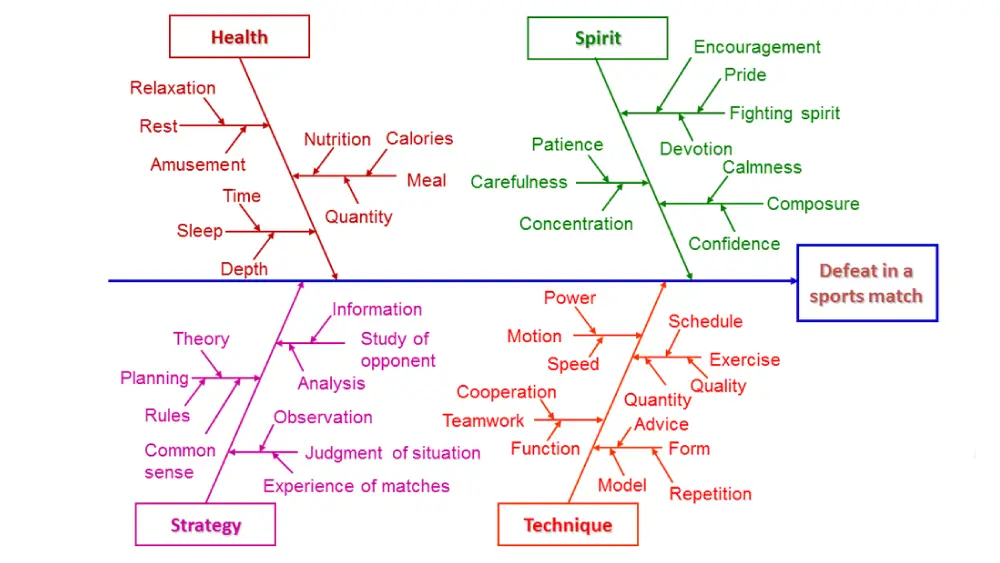
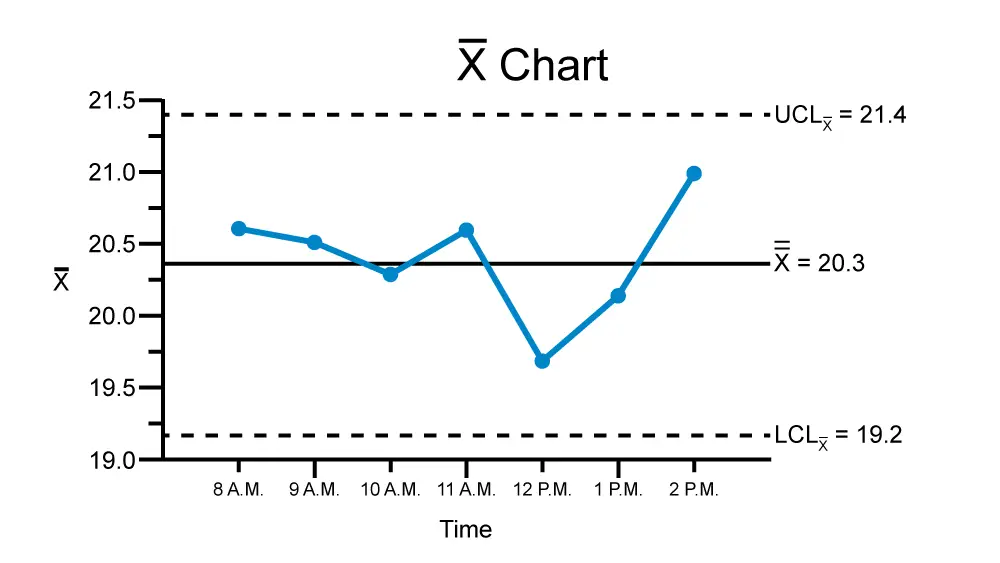
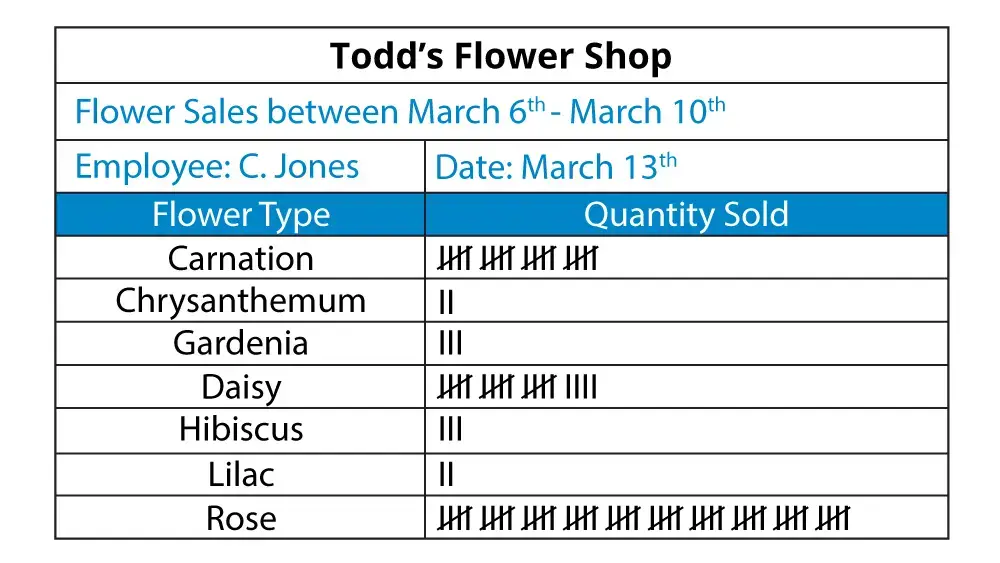
THORS STUDENT PACKAGES: 7QC Tools SERIES 7QC Tools Mastery 7QC Series Module 2 Courses: 7 QC Tools: Pareto Charts 7 QC Tools: Fishbone Diagrams 7 QC Tools: Control Charts 7QC Mastery is the second module in the 7QC Tools Series — focusing on advanced quality tools used to prioritize problems,

Read More »

7QC Tools Prep Module

THORS STUDENT PACKAGES: 7QC Tools SERIES 7QC Tools Prep 7QC Series Module 2 Courses: 7 QC Tools: Stratification 7 QC Tools: Check Sheets 7 QC Tools: Scatter Diagrams 7 QC Tools: Histograms 7QC Prep Essentials is the first module in the 7QC Tools Series — covering the foundational quality control

Read More »

7QC Tools Prep Series

THORS STUDENT PACKAGES: 7QC Tools Prep SERIES Bridge the gap between the classroom and your dream job. ​ Get the real-world understanding of the 7QC Tools used by leading manufacturers. Go beyond theory. Learn the terminology, processes, and workflows manufacturers use to analyze production data—and explain clearly why those insights

Read More »
Diagram depicting stratified sampling where data is collected and sorted from a population into smaller logical segments

7QC Tools: Stratification

7QC Tools: Stratification is an interactive course designed for any learner who must be familiar with the concept of stratification and how it is used. Ready to take the next step? Explore the course details and see everything we’ve packed into this program!

Learning Hours: .5

Representative or member of a corporation, educational institution, or trade organization? Contact us to discuss special pricing and additional benefits, including course activity reports for your group.

Contact Sales For Group Pricing

Read More »
Example scatter plot showing stratified data

7QC Tools: Scatter Diagrams

7QC Tools: Scatter Diagrams is an interactive course designed for any learner who must be familiar with the concept of scatter diagrams and how these graphs are used. Ready to take the next step? Explore the course details and see everything we’ve packed into this program!

Learning Hours: .5

Representative or member of a corporation, educational institution, or trade organization? Contact us to discuss special pricing and additional benefits, including course activity reports for your group.

Contact Sales For Group Pricing

Read More »
Example pareto chart demonstrating the 80/20 rule

7QC Tools: Pareto Charts

7QC Tools: Pareto Charts is an interactive course designed for any learner who must be familiar with the concept of Pareto charts and how these charts are used. Ready to take the next step? Explore the course details and see everything we’ve packed into this program!

Also available in Tamil.

Learning Hours: .5

Representative or member of a corporation, educational institution, or trade organization? Contact us to discuss special pricing and additional benefits, including course activity reports for your group.

Contact Sales For Group Pricing

Read More »
Frequency distribution chart showing multiple modes known as multimodal distribution

7QC Tools: Histograms

7QC Tools: Histograms is an interactive course designed for any learner who must be familiar with the concept of histograms and how these charts are used. Ready to take the next step? Explore the course details and see everything we’ve packed into this program!

Also available in Tamil.

Learning Hours: .5

Representative or member of a corporation, educational institution, or trade organization? Contact us to discuss special pricing and additional benefits, including course activity reports for your group.

Contact Sales For Group Pricing

Read More »
Example fishbone diagram showing primary and secondary causes of being defeated in a sports match

7QC Tools: Fishbone Diagrams

7QC Tools: Fishbone Diagrams is an interactive course designed for any learner who must be familiar with a fishbone diagram and how it is used. Ready to take the next step? Explore the course details and see everything we’ve packed into this program!

Also available in Tamil.

Learning Hours: .5

Representative or member of a corporation, educational institution, or trade organization? Contact us to discuss special pricing and additional benefits, including course activity reports for your group.

Contact Sales For Group Pricing

Read More »
Example average chart showing plotted data points within the upper and lower control limits

7QC Tools: Control Charts

7QC Tools: Control Charts is an interactive course designed for any learner who must be familiar with the concept of control charts and how these graphs are used. Ready to take the next step? Explore the course details and see everything we’ve packed into this program!

Learning Hours: 1

Representative or member of a corporation, educational institution, or trade organization? Contact us to discuss special pricing and additional benefits, including course activity reports for your group.

Contact Sales For Group Pricing

Read More »
Example check sheet showing sales of each product for a small shop

7QC Tools: Check Sheets

Learn the concept of 7QC Tools: Check Sheets and how they are used. In this course, learners engage with animations and step-by-step demonstrations that provide real world application to help learners better understand and use this quality tool. Ready to take the next step? Explore the course details and see everything we’ve packed into this program!

Also available in Tamil.

Learning Hours: .5

Representative or member of a corporation, educational institution, or trade organization? Contact us to discuss special pricing and additional benefits, including course activity reports for your group.

Contact Sales For Group Pricing

Read More »