


Training
Training Programs are Critical to Attracting and Retaining Talent
In today’s rapidly changing business landscape, organizations face a unique set of challenges in finding, hiring, and retaining top talent. The tight labor market has
Quality
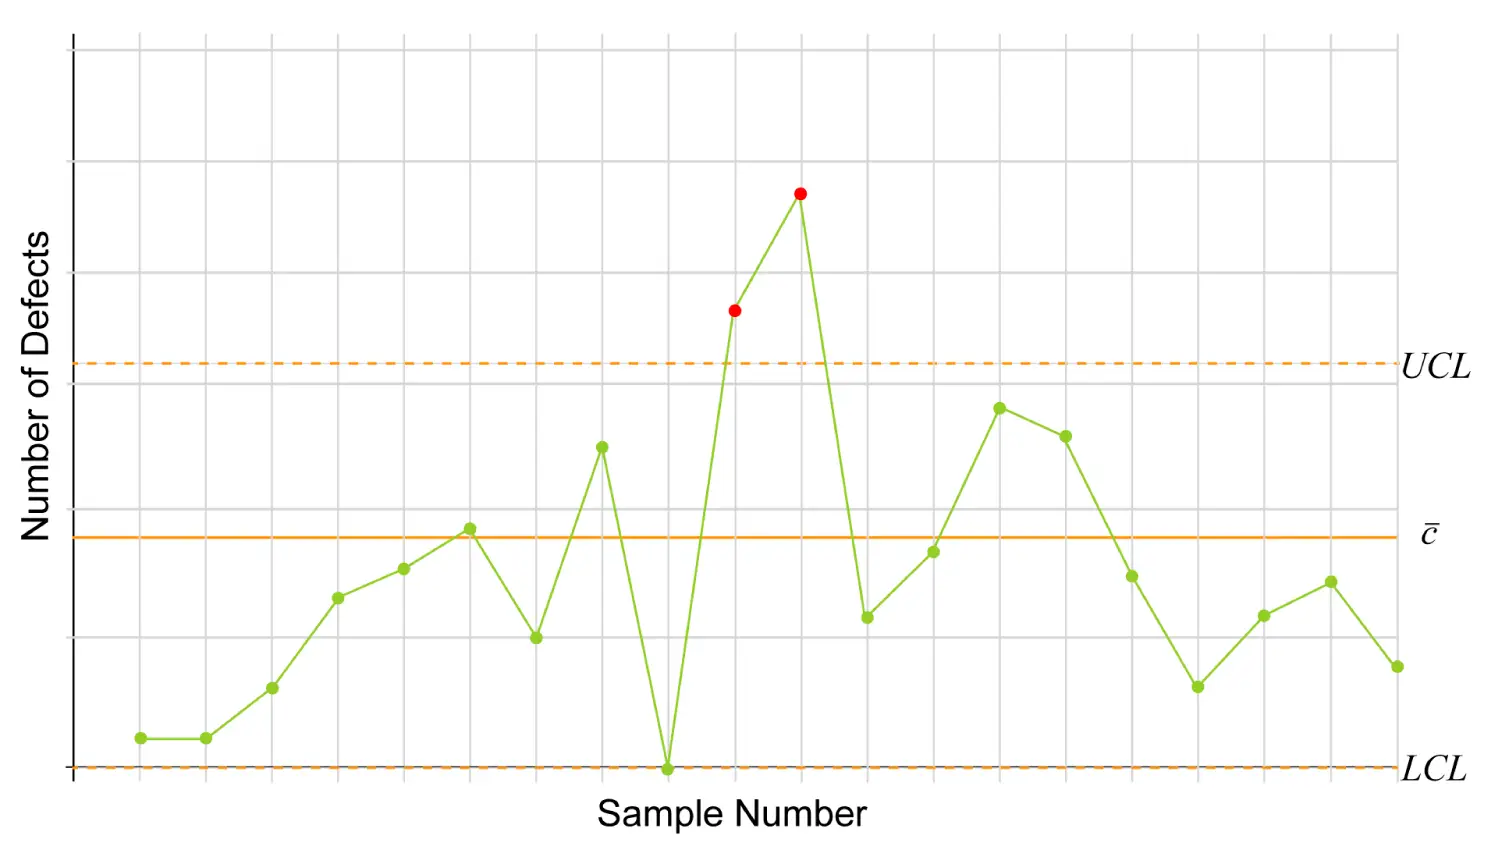
A Guide to Selecting Variable Data Control Charts for SPC
To monitor, control, and improve manufacturing processes, a systematic approach such as Statistical Process Control (SPC) is indispensable in evaluating the stability of a particular

Training
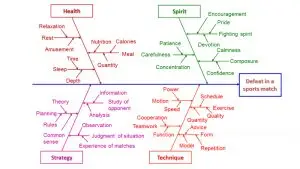
5 Ways to Reduce Human Errors in Manufacturing
We cannot change the human condition, but in manufacturing we can certainly improve the way people work, where they work, and what systems they use.