

Training
The Role of Virtual Reality in Technical Training
In the rapidly evolving landscape of technology and industry, virtual reality (VR) in technical training is leading a revolutionary transformation in how professionals are trained.
Quality
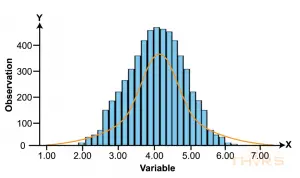
What is Statistical Distribution in SPC?
Statistical distribution in Statistical Process Control (SPC) and probability theory help to model real-world phenomena and to make predictions based on data. As a result,
Quality
A Guide to Selecting Variable Data Control Charts for SPC
To monitor, control, and improve manufacturing processes, a systematic approach such as Statistical Process Control (SPC) is indispensable in evaluating the stability of a particular