

Training
5 Ways to Reduce Human Errors in Manufacturing
We cannot change the human condition, but in manufacturing we can certainly improve the way people work, where they work, and what systems they use.

Training
Cross-Cultural Training Benefits
Understanding Cross-Cultural Training In today’s interconnected world, businesses are expanding beyond borders. To thrive globally, organizations must equip their employees with cross-cultural skills. Cross-cultural training

Quality
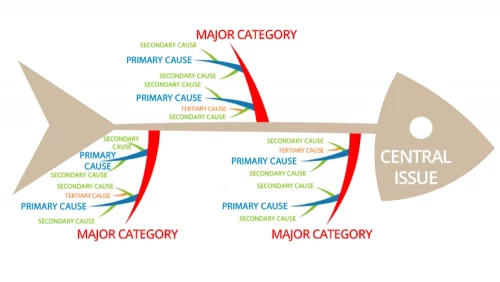
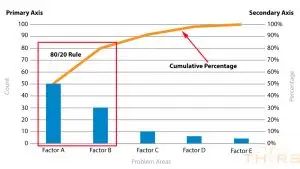
Essential Quality Terms Used in 7QC Tools
The 7QC tools are statistical tools that help individuals, organizations, and businesses resolve quality issues for products and processes. To utilize the 7QC tools it