
Training
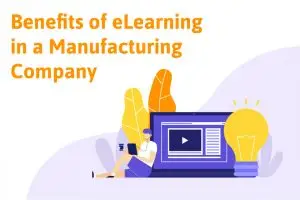
Benefits of eLearning in Manufacturing
In the world of manufacturing, training is essential. Every employee needs to understand how to use equipment, follow procedures, and maintain quality standards. With the advent

Career Planning
The Essential Skills of Modern Purchasing Professionals
In my professional career that spans more than three decades, I have had the privilege of working closely with purchasing. I can attest to the
Training
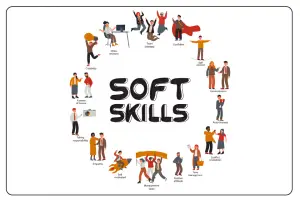
Developing Soft Skills in the Tech Industry
Soft skills in the tech industry, where precision and expertise are paramount, might seem secondary. However, soft skills such as communication, teamwork, and problem-solving, play