THORS STUDENT PACKAGES: 7QC Tools SERIES

7QC Tools Mastery

7QC Series Module 2 Courses:

7QC Mastery is the second module in the 7QC Tools Series — focusing on advanced quality tools used to prioritize problems, identify root causes, and control processes in manufacturing and operational environments. These three courses build on foundational QC knowledge to strengthen analytical thinking and data-driven problem-solving skills.

You’ll gain the knowledge needed to:

Module 1 Price:
₹13,500 ₹2,250
Package discount (83% off)

This module includes: 

Course Details:

Explore how Pareto charts are used to prioritize problems and identify the most significant contributors to issues, how fishbone (cause-and-effect) diagrams structure effective root cause analysis, and how control charts are used to monitor process performance and detect variation over time. This module also focuses on applying these advanced tools to real quality, process, and performance challenges to drive data-driven improvement and control.

7 QC Tools: Pareto Charts

Course Description

7QC Tools: Pareto Charts is an interactive course designed for any learner who must be familiar with the concept of Pareto charts and how these charts are used. In this course, learners engage with animations and step-by-step demonstrations that provide real world application to help learners better understand and use this quality tool.

Learning Objectives
  1. Understand what Pareto charts are and the Pareto principle.
  2. Apply the principles of Pareto charting when analyzing data.
Who will benefit from this course?

All Functions: Quality, Sales, Engineering, Manufacturing, Purchasing.

Learning Hours: .5

Course Description

7QC Tools: Fishbone Diagrams is an interactive course designed for any learner who must be familiar with a fishbone diagram and how it is used. In this course, learners engage with animations and step-by-step demonstrations that provide real world application to help learners better understand and use this quality tool.

Learning Objectives
  1. Understand how to use a fishbone diagram.
  2. Recognize the components of a fishbone diagram.
Who will benefit from this course?

All Functions: Quality, Sales, Engineering, Manufacturing, Purchasing.

Learning Hours: .5

Course Description

7QC Tools: Control Charts is an interactive course designed for any learner who must be familiar with the concept of control charts and how these graphs are used. In this course, learners engage with animations and step-by-step demonstrations that provide real world application to help learners better understand and use this quality tool.

Learning Objectives
  1. Understand what control charts are and how they are used.
  2. Identify the different types of control charts.
  3. Interpret potential trends resulting from special cause variations.
  4. Construct and analyze Xbar and R charts.
Who will benefit from this course?

Any learner who must be familiar with the concept of control charts and how to use these charts.

Learning Hours: 1

Ready to Empower Your Career?

See how the THORS Academy courses can help you master industry-relevant knowledge and perform at your best.

THORS: The Gold Standard in Technical Manufacturing Training

Since 2012, THORS eLearning Solutions has been transforming manufacturing education through THORS Academy, a visually engaging and ever-expanding eLearning library of over 230+ expert-developed courses.
 
THORS is trusted by Fortune 500 manufacturing companies, universities,  and global suppliers who are committed to empowering their workforce to learn, adapt and grow through online courses and AI-powered productivity tools. To date, over 250,000 manufacturing professionals and students worldwide have advanced their expertise using THORS Academy. 

Latest from the Blog

what is EMC in Automotive Wiring Harness Design? Electronics

EMC in Automotive Wiring Harness Design: Key Principles and Best Practices

What Is EMC in Automotive Wiring Harness Design? Electromagnetic Compatibility (EMC) in automotive wiring harness ...
Read More →
Industrial products made from aluminum Aluminum

Why Heat Treatment Matters for Industrial Aluminum Products

Aluminum is widely valued for being lightweight, corrosion-resistant, and easy to fabricate. However, in its ...
Read More →
Electronics

Why Is PLC Ladder Diagram (LD) Widely Used in Industries? 

PLC Ladder Diagram (LD) is one of the most widely used programming languages in PLC ...
Read More →
An electronic project with a motherboard and various connected wires and components. Electronics

Power Converters Explained: AC to DC, DC to AC, AC to AC, and DC to DC

In electronics, power converters are devices that transform an input signal from one state or ...
Read More →
A schematic drawing of electrical circuits. Engineering Drawings
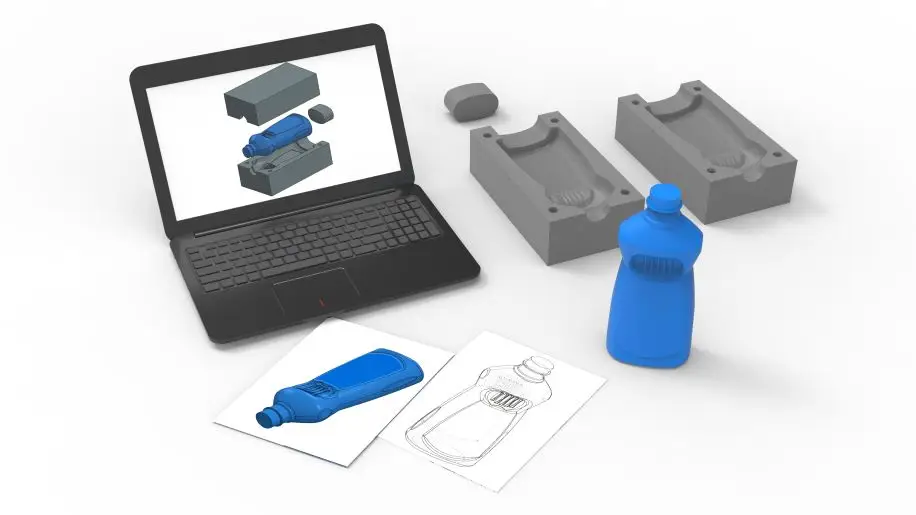
Reading Electrical Drawings: Why This Skill Is Essential for Electrical Engineers

Electrical drawings bridge the gap between conceptual design and the practical implementation of electrical circuits. ...
Read More →
Laptop screen showing a mold and product design with printouts of the design and the actual mold and product near the laptop. Injection Molding

Injection Mold Design: How the Right Strategies Can Optimize Cycle Time and Production

In injection molding, every second of cycle time directly impacts profitability. Strategic mold design decisions ...
Read More →
Circular arrangement of injection molded plastic spoon placed on a table with an injection molding machine behind. Injection Molding

8 Common Injection Mold Design Mistakes and Tips to Avoid Them

Injection molding is a widely used process for producing mass quantity of plastic components, but ...
Read More →
A group of foundry workers pouring the molten metal to a prepared mold. Castings

The Impact of a Well-Executed Shakeout on Casting Efficiency

Shakeout may seem like a routine step in the casting process, but its impact goes ...
Read More →
variable data control charts in SPC Quality

A Guide to Selecting Variable Data Control Charts for SPC

To monitor, control, and improve manufacturing processes, a systematic approach such as Statistical Process Control ...
Read More →